MBS Mohammed Baobaid
All projects
Project
Public release Open Source Software Created 22 March 2026

MBS Uptime Monitor

An open-source Laravel status page, uptime monitor, and installable probe package for keeping watch over other Laravel apps.

Created 22 March 2026, MBS Uptime Monitor is a MIT-licensed monitoring system split into two public GitHub repositories: MBS-Uptime-Moniter, the self-hosted monitor application, and MBS-Uptime-Moniter-Package, the Composer package that can be installed inside other Laravel applications. Together they provide a public status page, private operations panel, scheduled check engine, incident workflow, subscriber notification surface, public API, and authenticated health/metadata probe layer.

Laravel 13 Filament 5 Livewire 4 Tailwind CSS 4 PHP 8.3+ Composer Package OpenAPI Queues PHPUnit
Narrated walkthrough

This audio is not a word-for-word copy of the case below. You can read the written case while listening to me explain the project in more detail.

0:00 / 0:00
Speed
MBS Uptime Monitor project preview
2 Repositories
4 Check drivers
11-13 Laravel support
MIT License

Role

Open-source maintainer, Laravel product engineer, and package author

Outcome

I built a public status product with a private Filament operations panel, queued uptime checks, incident publishing, subscriber flows, OpenAPI documentation, and a reusable Laravel probe package that lets monitored apps describe their own components, health checks, and service metadata.

The Challenge

Small Laravel applications often rely on shallow uptime checks that only prove one URL can respond. I wanted a monitor that could explain the public state of a system, keep incident communication human-controlled, notify subscribers, expose a clean public API, and understand deeper Laravel health signals from apps that install a lightweight package.

The Approach

I designed the project as a product plus package pair. The monitor app owns the public status experience, Filament admin workflows, scheduled check execution, status rollups, incident communications, and JSON API. The probe package lives inside monitored Laravel apps and exposes bearer-protected health and metadata endpoints so the monitor can import services, components, and HTTP checks automatically.

How it works

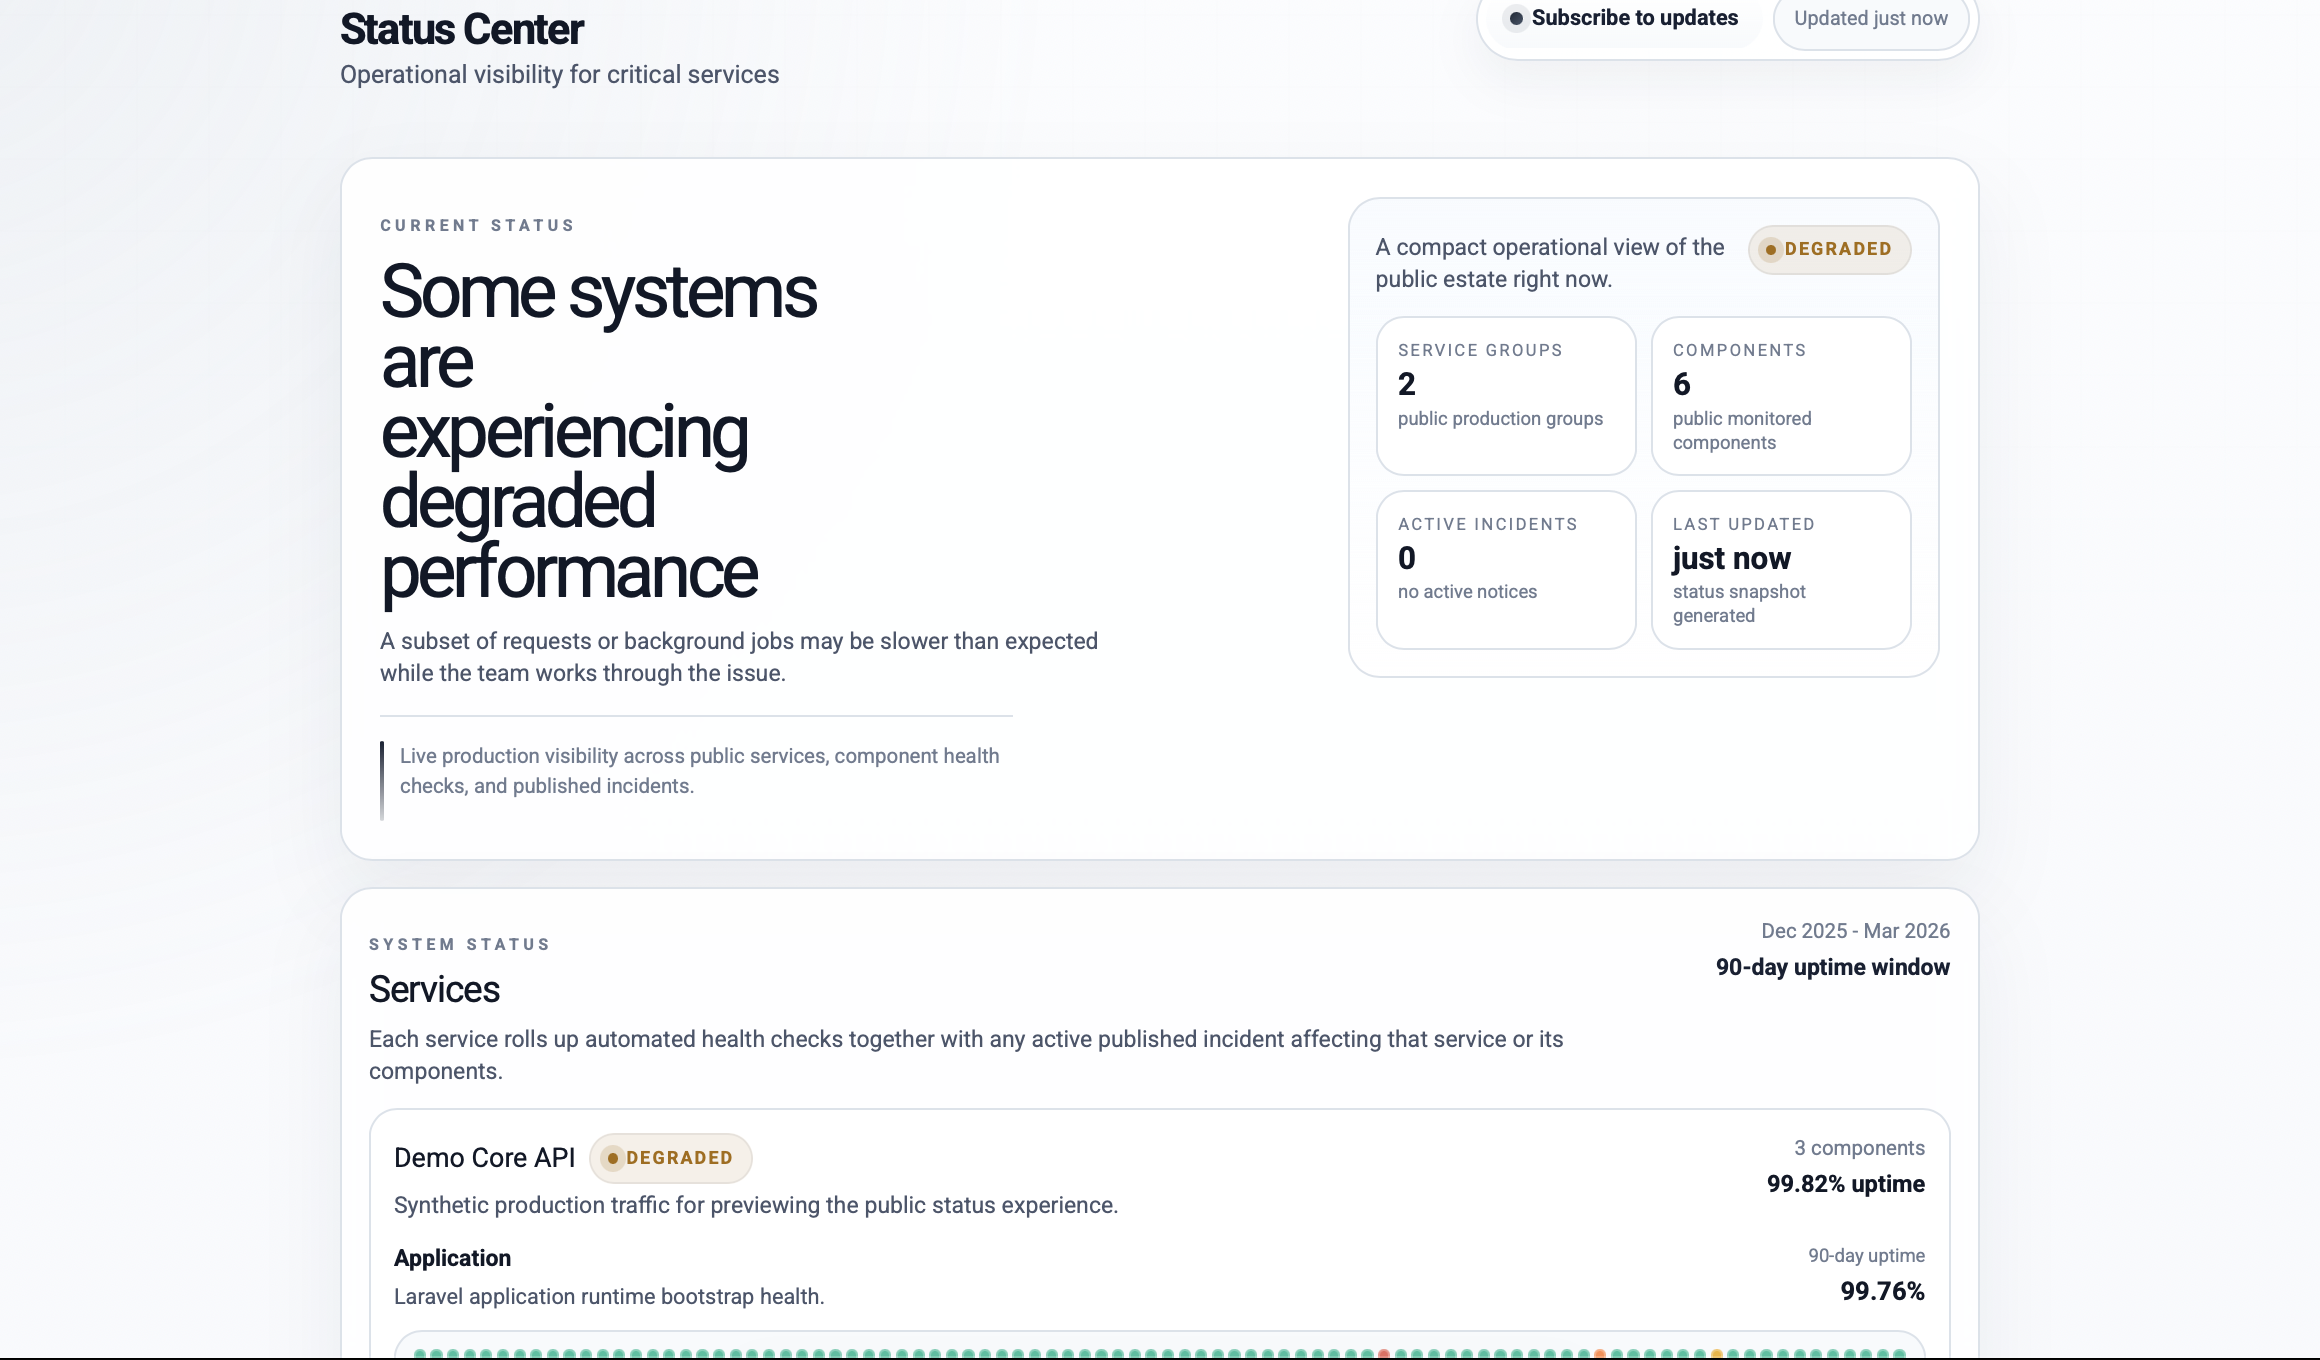
Preview of the monitoring product

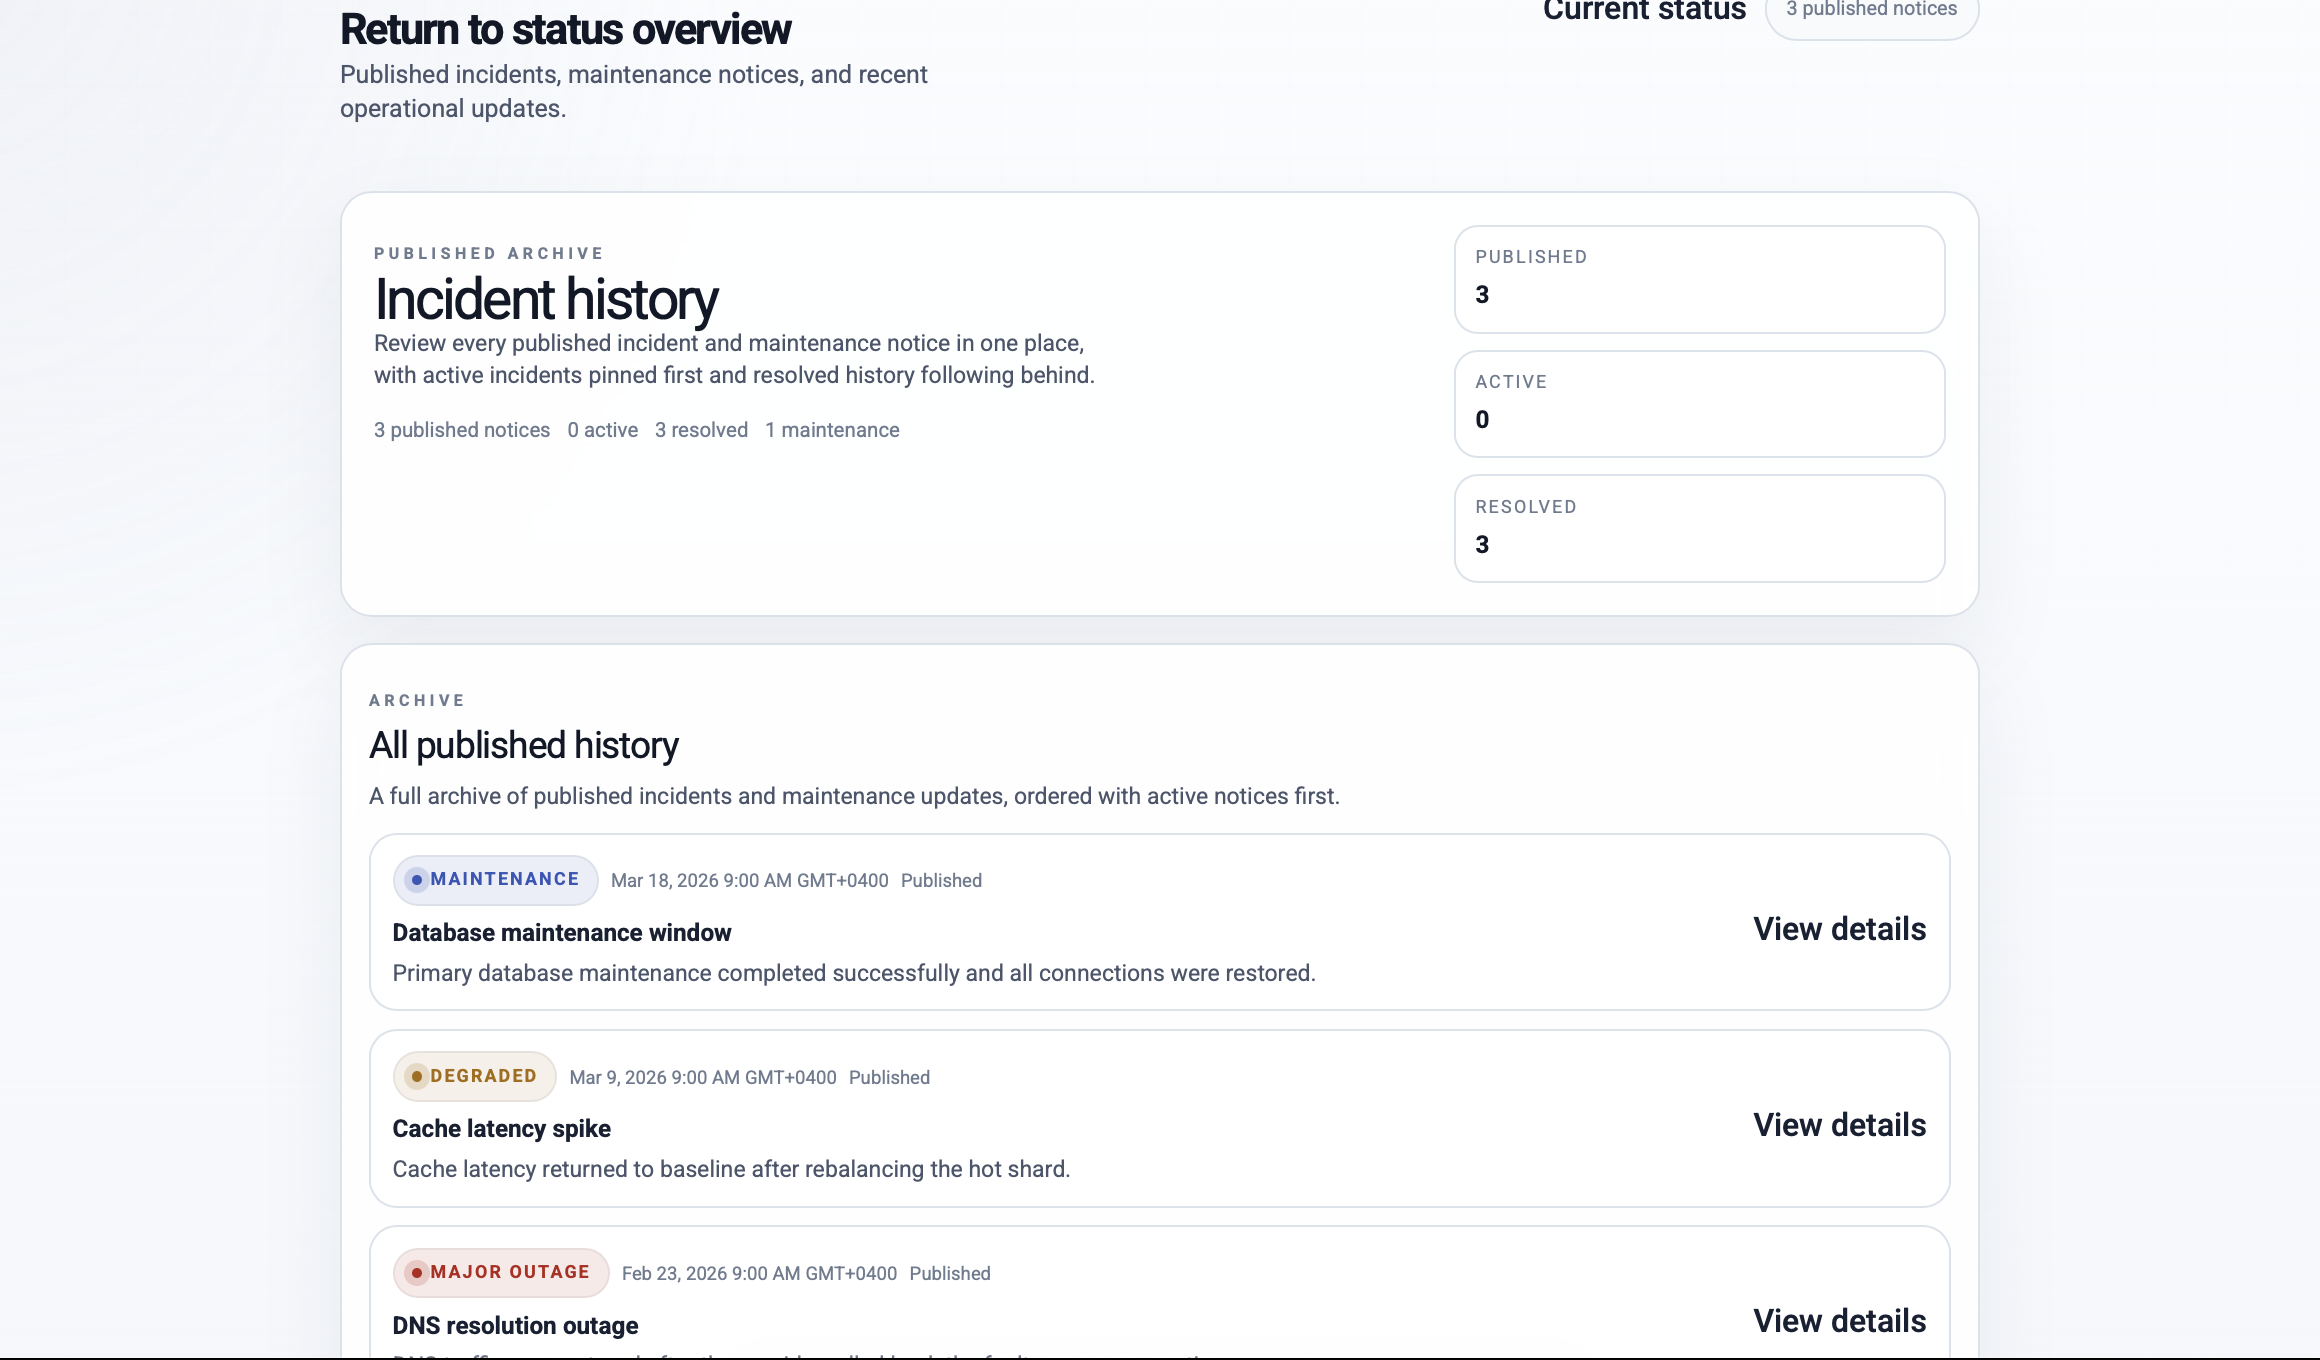
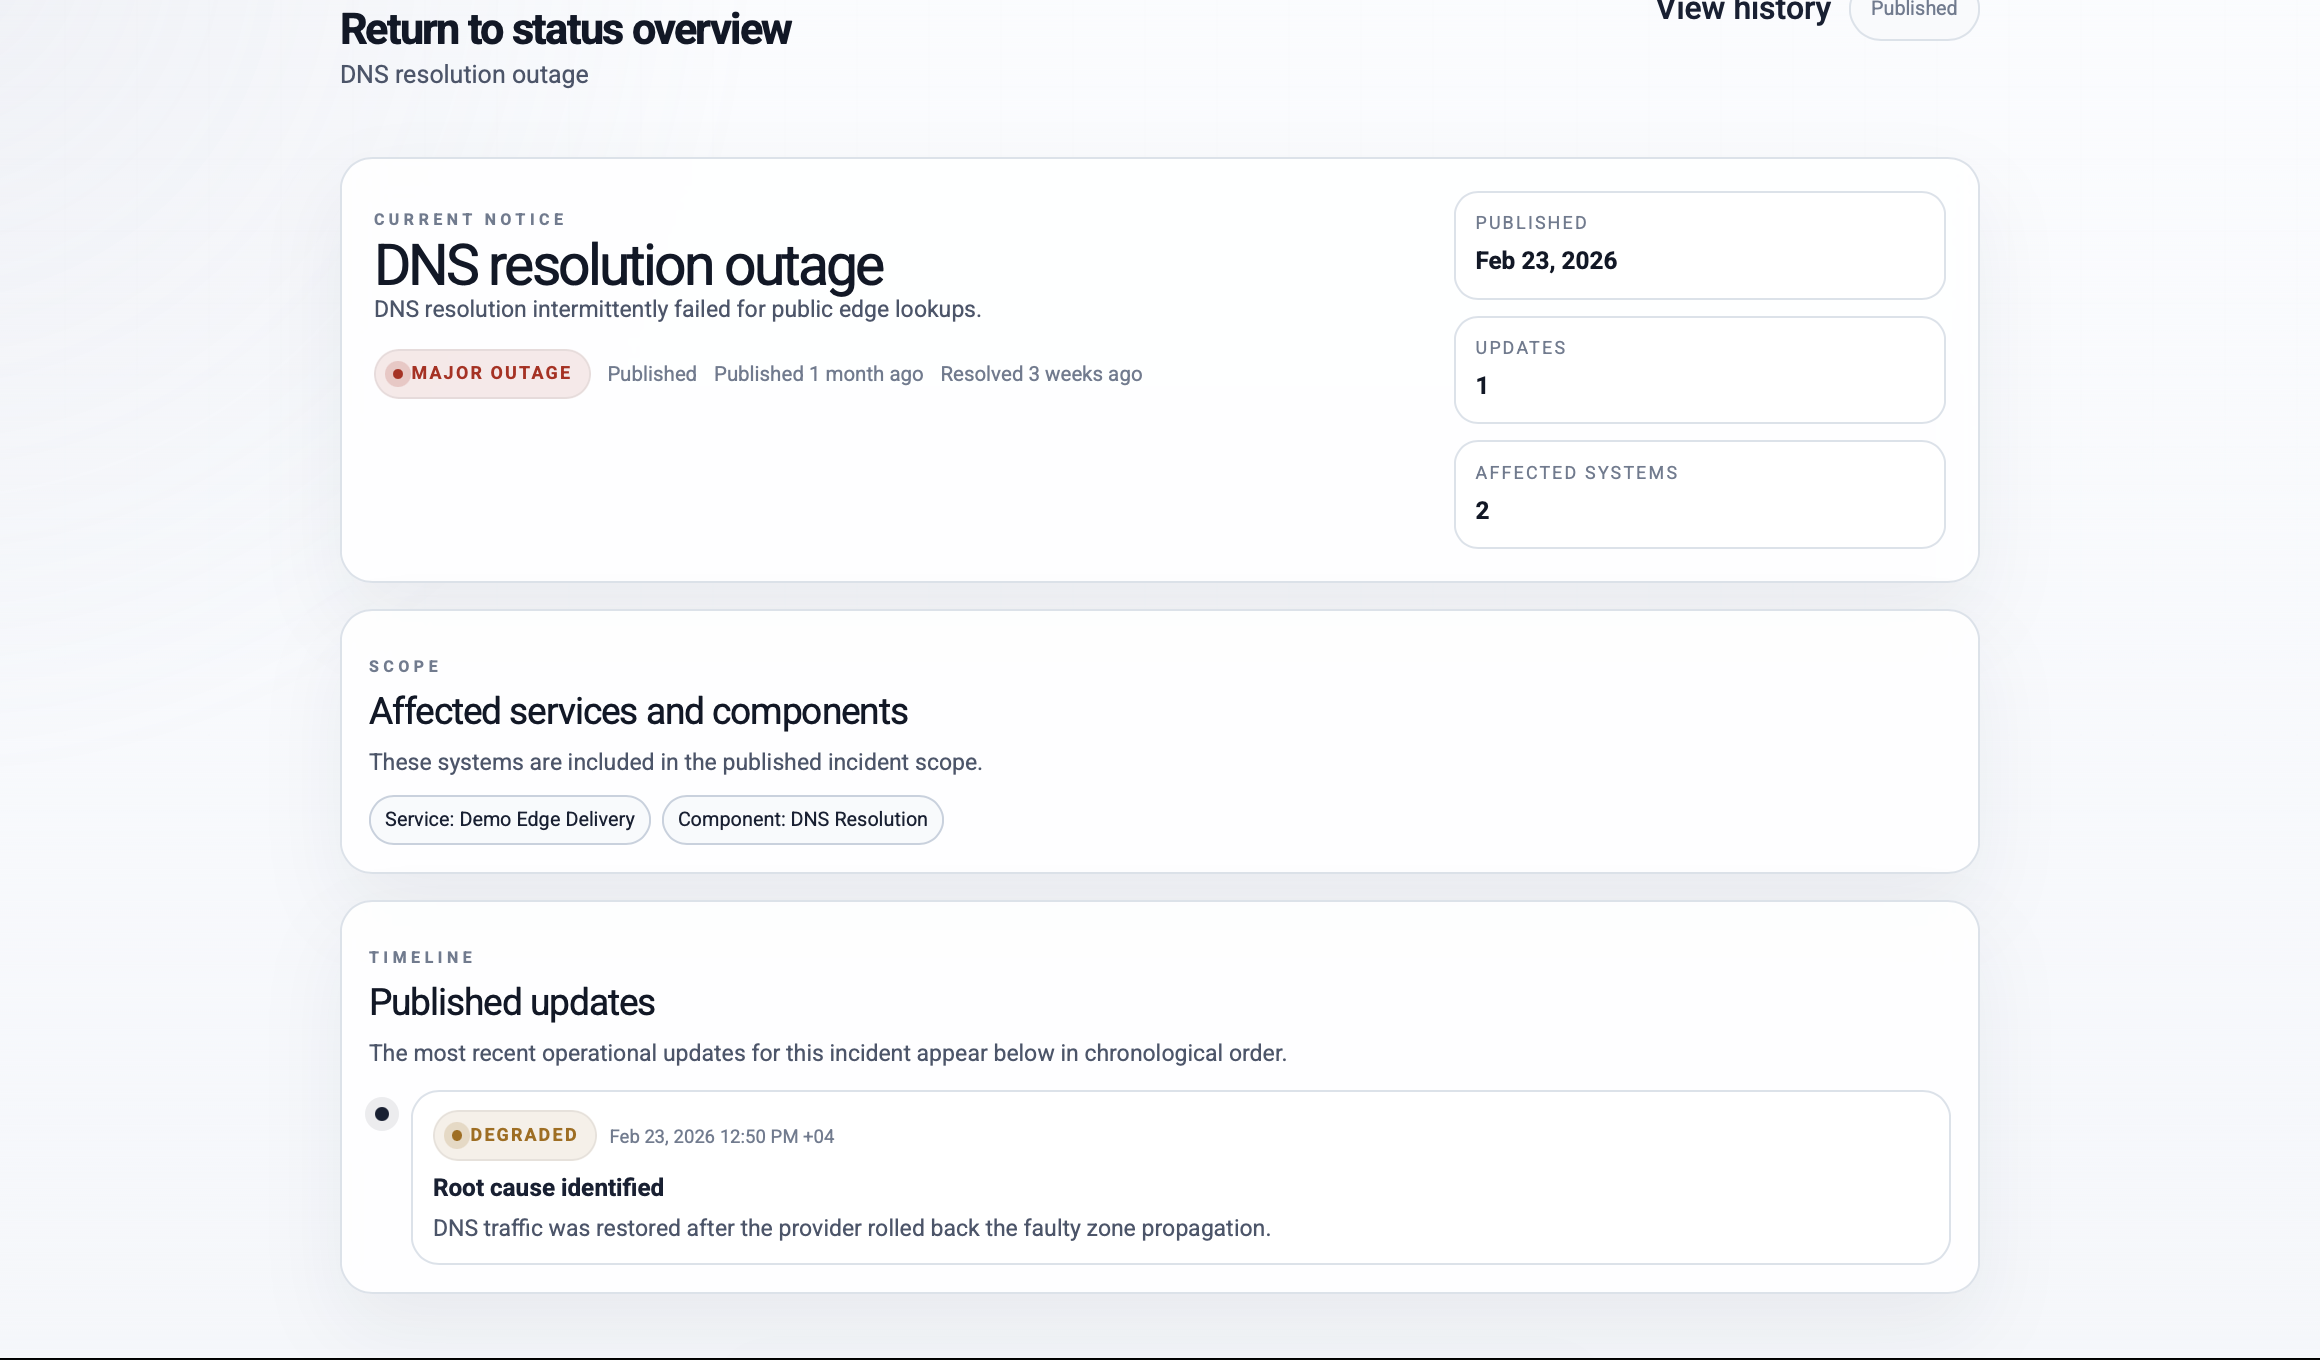
The public-facing side of the monitor is designed as a status center: visitors can quickly understand whether systems are healthy, which services are affected, what incidents are active, and how recent the status snapshot is. I kept the preview practical rather than decorative because this kind of tool has to be trusted under pressure.

MBS Uptime Monitor public status overview with degraded performance summary and service uptime cards
Public status preview showing the overall state, service groups, component counts, active incidents, and 90-day uptime window.

I split the system into an app and a package

The main repository contains the self-hosted Laravel monitor: public status pages, private admin tools, check scheduling, incident publishing, subscriber flows, API documentation, and operational docs. The package repository contains mbs047/laravel-status-probe, the lightweight package installed inside Laravel apps that need to be monitored.

The package turns monitored apps into first-class probes

After installing the package with composer require mbs047/laravel-status-probe and running php artisan status-probe:install, a Laravel app can expose bearer-protected GET /status/health and GET /status/metadata endpoints. The monitor can then pull app health, read component metadata, and map checks such as checks.db.status back into component-level status.

The check engine covers external and Laravel-aware monitoring

The monitor supports HTTP, SSL, DNS, and TCP checks. HTTP checks can validate expected status codes, latency, required text, JSON assertions, basic or bearer auth, and JSON status paths coming from package-enabled Laravel apps. Due checks are dispatched on schedule, executed through queued jobs, stored as check runs, and rolled up into component and service health.

Incident communication stays human-controlled

Automated checks detect failures, but they do not automatically publish incidents. Admins can draft, publish, update, and resolve incidents through the operations panel, while subscribers receive confirmation, incident, update, and resolution emails only for published communication.

MBS Uptime Monitor incident history page
Incident history keeps public communication separate from raw automated check failures.
MBS Uptime Monitor incident detail page with timeline updates
Incident detail pages show severity, affected areas, and timeline updates for a public audience.

Remote integrations support pull, push, and hybrid workflows

The monitor can pull metadata from a remote package-enabled app, accept a pushed registration payload from php artisan status-probe:register, or combine both approaches. That makes the package useful in different deployment contexts: the monitor can discover apps, apps can register themselves, or teams can use hybrid sync when they want stronger control.

Security and operations were part of the project, not an afterthought

The system treats monitoring as operational software. First-admin setup is protected by APP_SETUP_TOKEN, probe registration uses monitor-side bearer tokens, remote probe endpoints are private by default, and production docs cover cron, queue workers, mail, backups, retention, and deployment paths. The repository also includes an OpenAPI 3.1 contract and example payloads for public API consumers.

What this project shows about my engineering style

This project combines product thinking with reusable package design. The monitor gives teams a clear operational surface, while the package lets other Laravel apps participate without copying status logic into every codebase. It shows how I structure open-source work: public-facing UX, admin workflows, queue-backed jobs, package contracts, documentation, and tests all designed as one system.

Results

  • Published a self-hosted Laravel monitor with public status pages, incident history, subscriber signup, and public API endpoints
  • Published an installable Composer package, `mbs047/laravel-status-probe`, for Laravel 11, 12, and 13 applications
  • Implemented four monitor check drivers: HTTP, SSL, DNS, and TCP
  • Built pull, push, and hybrid remote integration flows so monitored apps can register themselves or be synced from the monitor
  • Documented installation, monitoring workflows, deployment operations, API contracts, and package extension points
  • Covered the app and package with focused PHPUnit tests for checks, integrations, subscriber flows, admin safety, and probe contributors

Key features

01 Self-hosted public status page with service groups, components, active incidents, and 90-day uptime history
02 Filament admin panel for services, components, checks, incidents, subscribers, platform settings, admins, and remote integrations
03 Automated HTTP, SSL, DNS, and TCP check drivers with thresholds, latency checks, JSON assertions, and check-run history
04 Manual incident workflow with draft, published, resolved states, timeline updates, and subscriber email notifications
05 Installable `mbs047/laravel-status-probe` package for Laravel 11, 12, and 13 apps
06 Authenticated health and metadata endpoints that support pull sync, push registration, queue heartbeats, scheduler heartbeats, and custom probe contributors

Tech stack

Laravel 13 Filament 5 Livewire 4 Tailwind CSS 4 PHP 8.3+ Composer Package OpenAPI Queues PHPUnit
Project links

Interested in similar work?

I build systems like this for teams that need reliable engineering, clean interfaces, and measurable outcomes.