MBS Mohammed Baobaid
All projects
Project
University project Data Analytics Created 15 April 2026 at 2:27 PM

Multivariate Performance Analysis of Firms

A PCA case study where I reduced 96 firm-level financial ratios into interpretable dimensions of solvency, profitability, cash flow, asset structure, and operating efficiency.

Created 15 April 2026 at 2:27 PM, this BANA482 case study was my multivariate performance analysis of firms using the Taiwanese Bankruptcy Prediction dataset. I treated PCA as a way to make complex financial statements readable: not to predict bankruptcy directly, but to discover the latent structure behind firm performance.

R R Markdown tidyverse corrplot factoextra psych patchwork ggrepel kableExtra Principal Component Analysis Dimensionality reduction KMO test Bartlett test Winsorization Z-score standardization Financial ratio analysis Score plots
Narrated walkthrough

This audio is not a word-for-word copy of the case below. You can read the written case while listening to me explain the project in more detail.

0:00 / 0:00
Speed
Multivariate Performance Analysis of Firms project preview
6,819 Firms
96 Ratios screened
5 Retained PCs
81.1% Variance explained

Role

Lead PCA analyst, report author, and presentation designer

Outcome

I analyzed 6,819 firms, screened 96 financial ratios, selected 14 interpretable PCA inputs, retained 5 principal components, and explained 81.1% of total variance. The strongest component, Liquidity and Solvency Strength, separated bankrupt and non-bankrupt firms by 2.942 standard units, making it useful as an early-warning monitoring score.

The Challenge

The dataset was wide, noisy, and financially dense: 6,819 firms with 96 ratios describing liquidity, leverage, profitability, cash flow, turnover, and capital structure. Looking at one ratio at a time would miss the way financial health is multivariate. My challenge was to reduce that complexity without flattening it into an oversimplified ranking.

The Approach

I built the case as an unsupervised financial-diagnosis workflow. I excluded the bankruptcy label from PCA construction, selected 14 representative financial ratios, winsorized extremes, standardized the variables, checked PCA suitability with KMO and Bartlett tests, retained components using eigenvalue and cumulative-variance evidence, interpreted loadings, and only then compared PCA scores by bankruptcy status as a validation step.

How it works

I used PCA to make firm performance interpretable

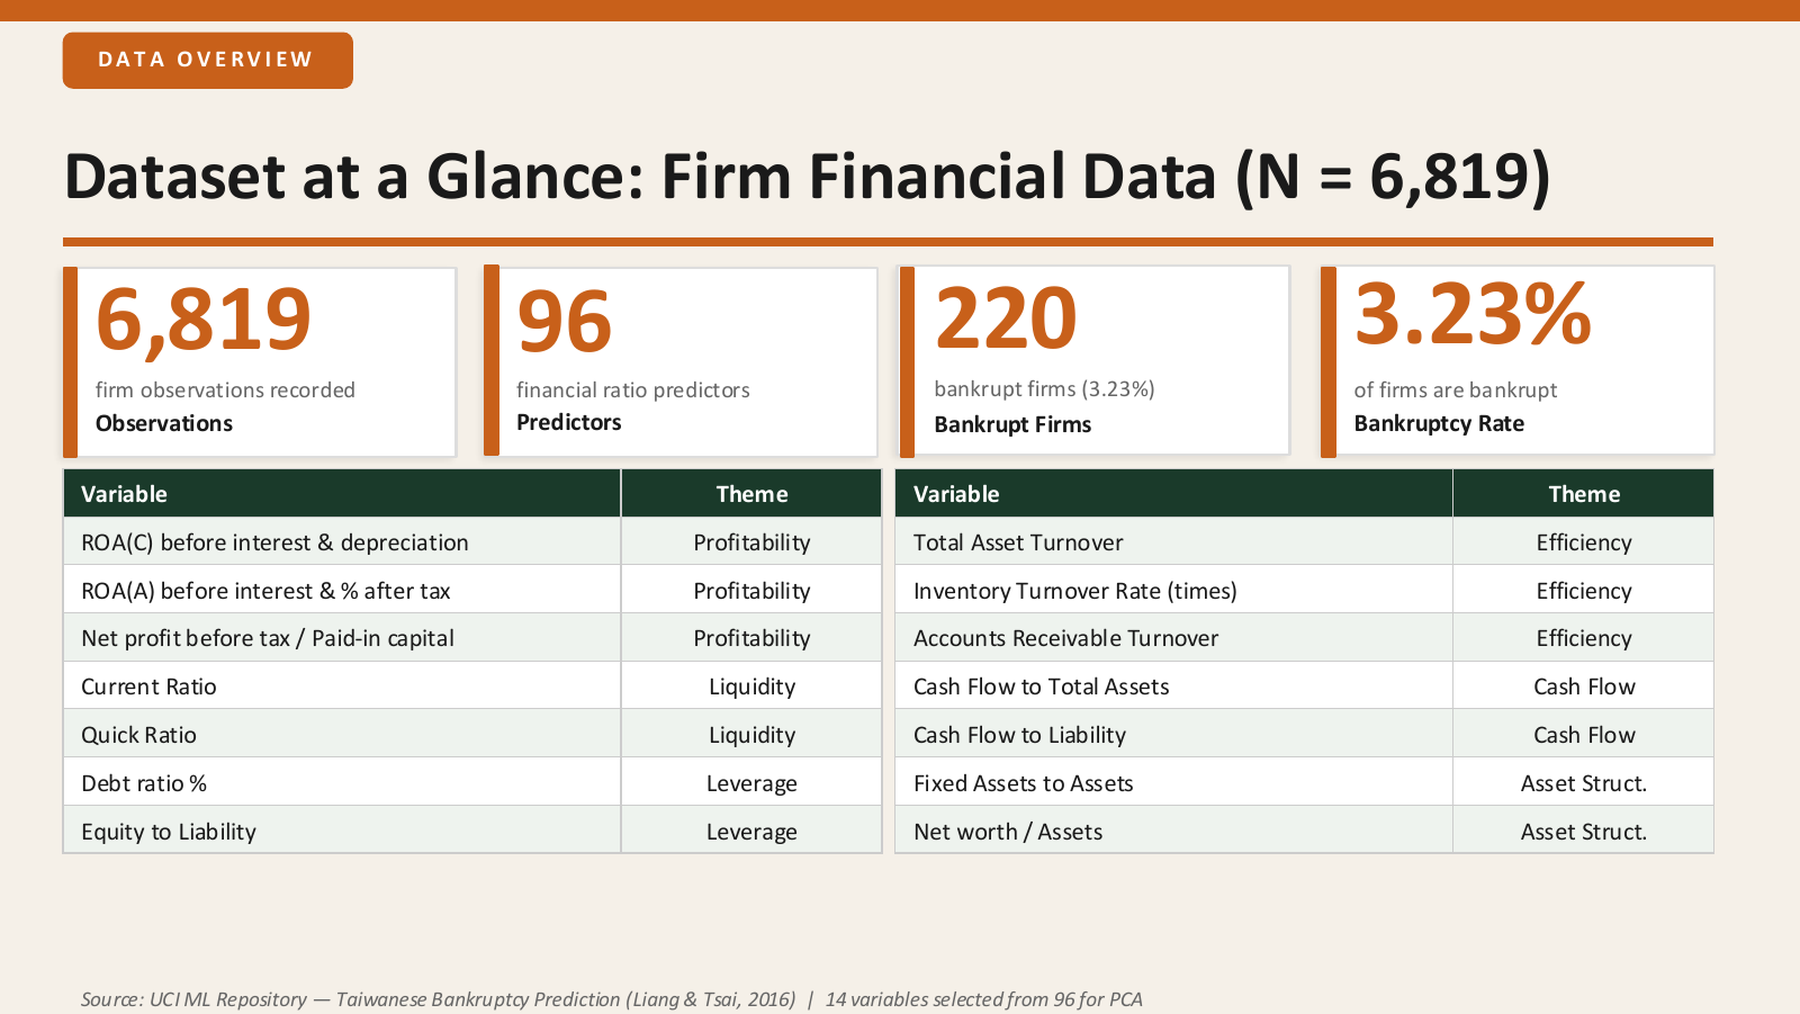
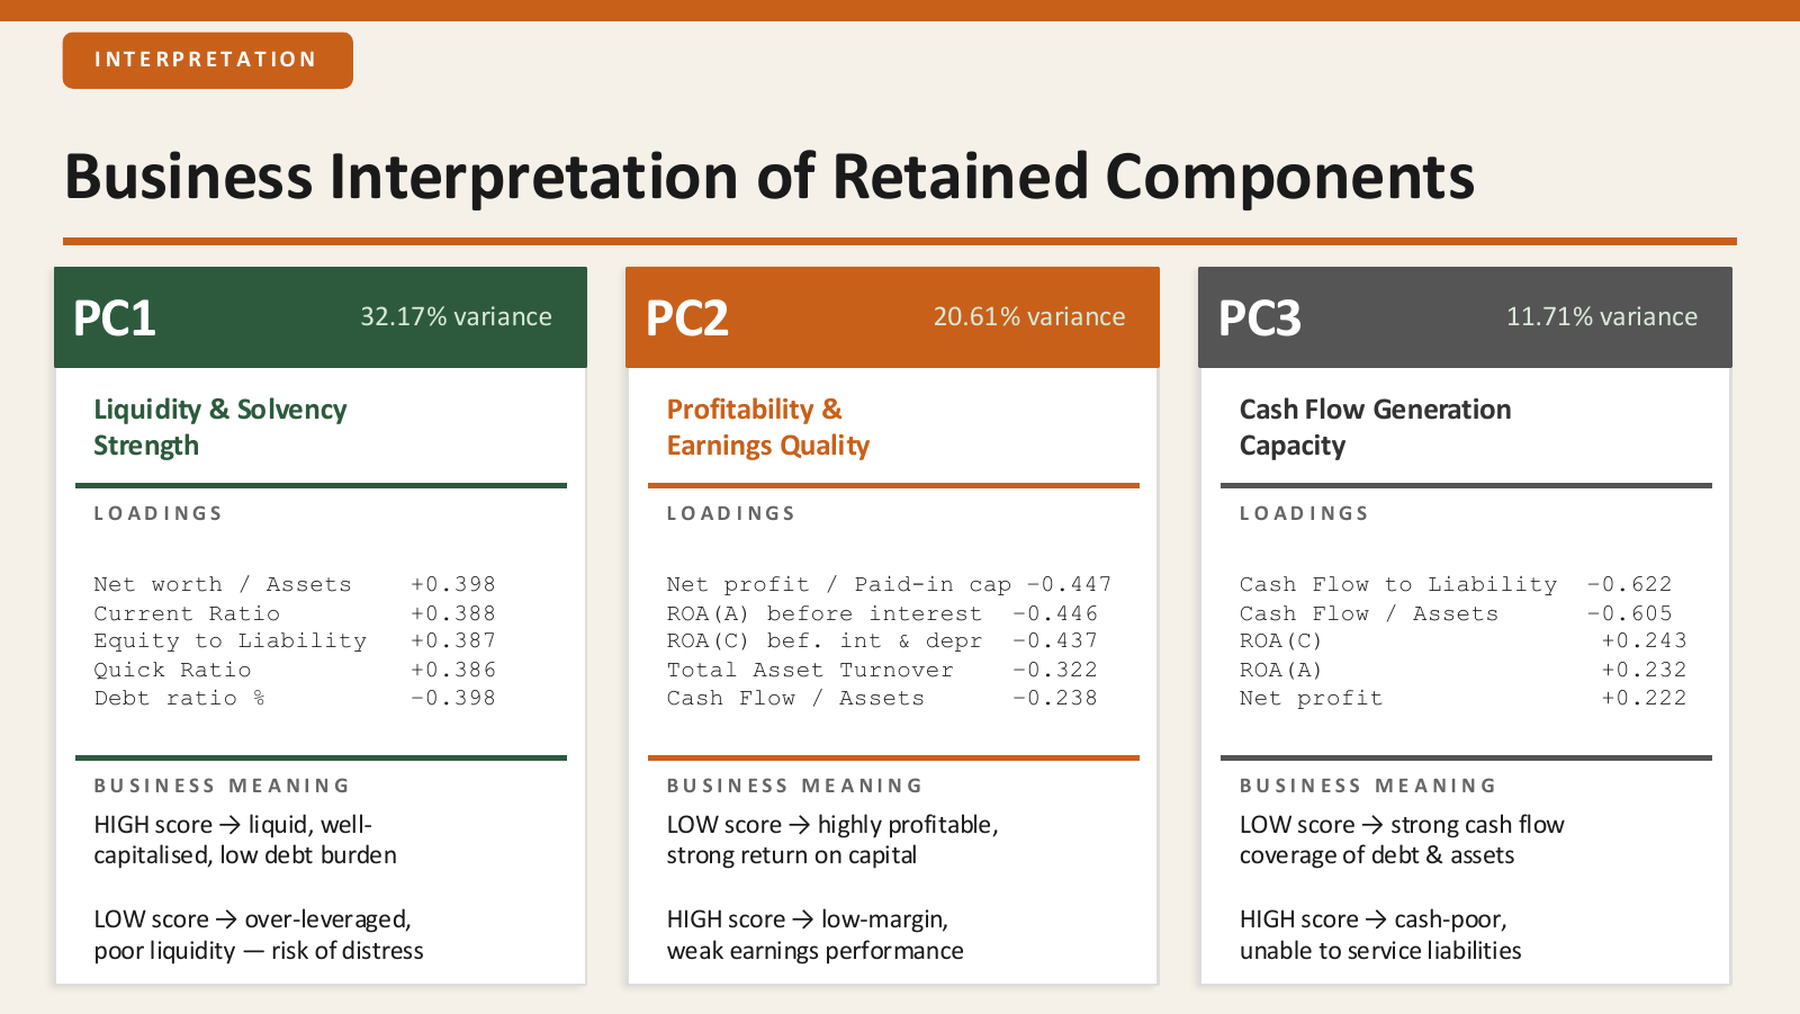
I framed this project around a practical finance question: when a firm has dozens of financial ratios, which underlying dimensions actually explain performance? PCA helped me move from a crowded ratio table to a smaller set of interpretable business signals. The goal was not to predict bankruptcy directly, because the bankruptcy label was excluded from the PCA inputs. The goal was to discover structure first, then test whether that structure made financial sense.

Presentation slide summarizing the Taiwanese Bankruptcy Prediction dataset with 6819 firms and 96 ratios
I started with the full firm-level dataset, then narrowed the problem to a financially meaningful PCA input set.

I selected ratios that covered finance, not just mathematics

The original dataset had 96 variables, but PCA is only useful when the inputs are interpretable. I selected 14 ratios that represented the major dimensions a financial analyst would care about: profitability, liquidity, leverage, asset structure, operating efficiency, and cash flow. I also winsorized extreme values at the 1st and 99th percentiles and standardized every variable so no ratio dominated simply because of scale.

Presentation slide showing the selected variables and standardization workflow for PCA
The ratio selection step kept the PCA grounded in financial reasoning instead of treating all columns as equally useful.

I tested whether PCA was justified

Before interpreting components, I checked whether the correlation structure supported PCA. The KMO statistic was 0.50, which is marginal but usable for exploratory work. Bartlett test was significant below 0.0001, confirming that the ratios were not independent noise. I used that evidence carefully: the data was suitable enough for exploratory PCA, but the interpretation still needed discipline.

I retained five components because both rules agreed

The retention decision was one of the most important parts of the case. The Kaiser rule identified five components with eigenvalues above 1, and the 80% cumulative-variance threshold also pointed to five components. Together, those five components explained 81.1% of the total variance, giving me enough compression to simplify the dataset without throwing away the main financial structure.

Presentation slide showing scree plot and cumulative variance evidence for retaining five principal components
The scree and cumulative-variance evidence supported a five-component solution.

I interpreted loadings as business dimensions

The loading matrix was where the case became financial rather than purely statistical. PC1 loaded positively on net worth/assets, current ratio, quick ratio, and equity-to-liability, and negatively on debt ratio. I interpreted it as Liquidity and Solvency Strength. PC2 was dominated by profitability measures, PC3 by cash-flow variables, PC4 by fixed assets and turnover, and PC5 by receivables turnover.

Presentation slide showing the PCA loading matrix and strongest variables for each retained component
I used the loading matrix to name each component in language that a finance audience could understand.

I named the latent dimensions in financial language

I translated the five retained components into a set of analytical lenses: Liquidity and Solvency Strength, Profitability and Earnings Quality, Cash Flow Generation Capacity, Asset Structure and Capital Intensity, and Receivables Efficiency. That translation mattered because PCA outputs are only useful when decision-makers can connect the component scores back to operating reality.

Presentation slide listing the five retained principal components and their business interpretation
The five PCA dimensions became a compact financial-performance framework.

I validated the components against bankruptcy status

After constructing the PCA without using the bankruptcy label, I compared component scores by bankruptcy status. This was the validation moment. Bankrupt firms averaged -2.847 on PC1, while non-bankrupt firms averaged +0.095, a 2.942 standard-unit gap. That result made PC1 more than a mathematical component: it behaved like a meaningful solvency signal.

Presentation slide comparing PCA component score means for bankrupt and non-bankrupt firms
The strongest component separated bankrupt and non-bankrupt firms even though the label was not used to build the PCA.

I turned PCA into a monitoring workflow

The case became most useful when I translated the results into a workflow. I recommended treating PC1 as a composite solvency score, flagging firms with PC1 below -2 for enhanced review, and tracking PC1 over time as part of an early-warning dashboard. I also proposed using the five PC scores as clean, uncorrelated inputs for future supervised models such as logistic regression or random forests.

Presentation slide summarizing managerial implications of the PCA scores
The PCA output became a decision-support structure rather than just a dimensionality-reduction exercise.

What this project says about how I work

This project feels personal because it shows the kind of analyst I am trying to become. I do not want to stop at software output or a polished chart. I want to understand the data, challenge whether the method is justified, name the result in business language, and then turn the analysis into something a manager could actually use. In this case, PCA helped me move from 96 ratios to five financial dimensions that were both statistically defensible and practically readable.

Results

  • The analysis used 6,819 firms from the Taiwanese Bankruptcy Prediction dataset, including 6,599 non-bankrupt firms and 220 bankrupt firms.
  • I reduced 96 available ratios to 14 PCA inputs that covered profitability, liquidity, leverage, operating efficiency, cash flow, and asset structure.
  • The KMO statistic was 0.50, which is marginal but acceptable for exploratory PCA, while Bartlett test significance below 0.0001 confirmed that the correlation matrix contained usable structure.
  • Both the Kaiser rule and the 80% cumulative-variance rule supported retaining five principal components.
  • The retained five components explained 81.1% of the variance: PC1 explained 32.17%, PC2 20.61%, PC3 11.71%, PC4 9.32%, and PC5 7.29%.
  • PC1 captured Liquidity and Solvency Strength through high positive loadings on net worth, current ratio, quick ratio, and equity-to-liability, with a negative loading on debt ratio.
  • Bankrupt firms had an average PC1 score of -2.847, while non-bankrupt firms averaged +0.095, creating a 2.942 standard-unit separation on the strongest component.
  • PC2 represented Profitability and Earnings Quality, PC3 captured Cash Flow Generation Capacity, PC4 described Asset Structure and Capital Intensity, and PC5 isolated Receivables Efficiency.
  • The final recommendation was to use PC1 as a monitoring score, flag firms with PC1 below -2 for enhanced review, and use the five PC scores as compact inputs for future predictive models.

Key features

01 Screened 96 financial-ratio variables from the Taiwanese Bankruptcy Prediction dataset
02 Selected 14 ratios spanning profitability, liquidity, leverage, cash flow, efficiency, and asset structure
03 Winsorized extreme values at the 1st and 99th percentiles before PCA
04 Standardized every PCA input with z-scores so ratios on different scales were comparable
05 Tested PCA suitability using KMO and Bartlett tests before interpreting components
06 Retained five principal components using both Kaiser and 80% cumulative-variance rules
07 Translated loading patterns into business-readable dimensions instead of generic PC labels
08 Validated component meaning by comparing PCA scores across bankrupt and non-bankrupt firms

Tech stack

R R Markdown tidyverse corrplot factoextra psych patchwork ggrepel kableExtra Principal Component Analysis Dimensionality reduction KMO test Bartlett test Winsorization Z-score standardization Financial ratio analysis Score plots
Project links

Interested in similar work?

I build systems like this for teams that need reliable engineering, clean interfaces, and measurable outcomes.