MBS Mohammed Baobaid
All projects
Project
University project Data Analytics Created 20 April 2026 at 4:05 PM

Trading Systems Literature Review

My reproducible literature-review pipeline for mapping trading-system research from Scopus records into defensible text-mining, bibliometric, and VOSviewer evidence.

I built this project as a research-grade case study, not just a collection of charts. My goal was to take a broad Scopus search around trading systems, platforms, interfaces, and decision support, then turn it into an auditable workflow that I could explain, rerun, and defend academically.

R Shiny tidytext bibliometrix VOSviewer ggplot2 Python PRISMA 2020 Scopus
Narrated walkthrough

This audio is not a word-for-word copy of the case below. You can read the written case while listening to me explain the project in more detail.

0:00 / 0:00
Speed
Trading Systems Literature Review project preview
588 Raw records
511 Included studies
20 Manual review
8,565 Unique tokens

Role

Principal researcher, pipeline developer, and visualization author

Outcome

I converted 588 raw Scopus records into a 511-study analytical corpus with PRISMA-style screening, text-mining outputs, bibliometrix evidence, VOSviewer maps, and a Shiny dashboard for inspection and export.

The Challenge

I was working with a literature that is scattered across finance, computer science, information systems, blockchain, energy markets, human-computer interaction, and decision-support venues. If I handled it as a normal spreadsheet review, I would lose the trail: which search query found each paper, how duplicates were removed, which papers were borderline, and why the final visual patterns should be trusted.

The Approach

I treated the review as a small research system. I rebuilt the Scopus exports into a controlled corpus, documented the screening flow, separated bibliographic metadata from abstract text, generated text-mining outputs, and then added bibliometrix and VOSviewer as independent analytical lenses. The Shiny dashboard became my quality-control surface, while the generated tables and figures became the evidence layer for the written case.

How it works

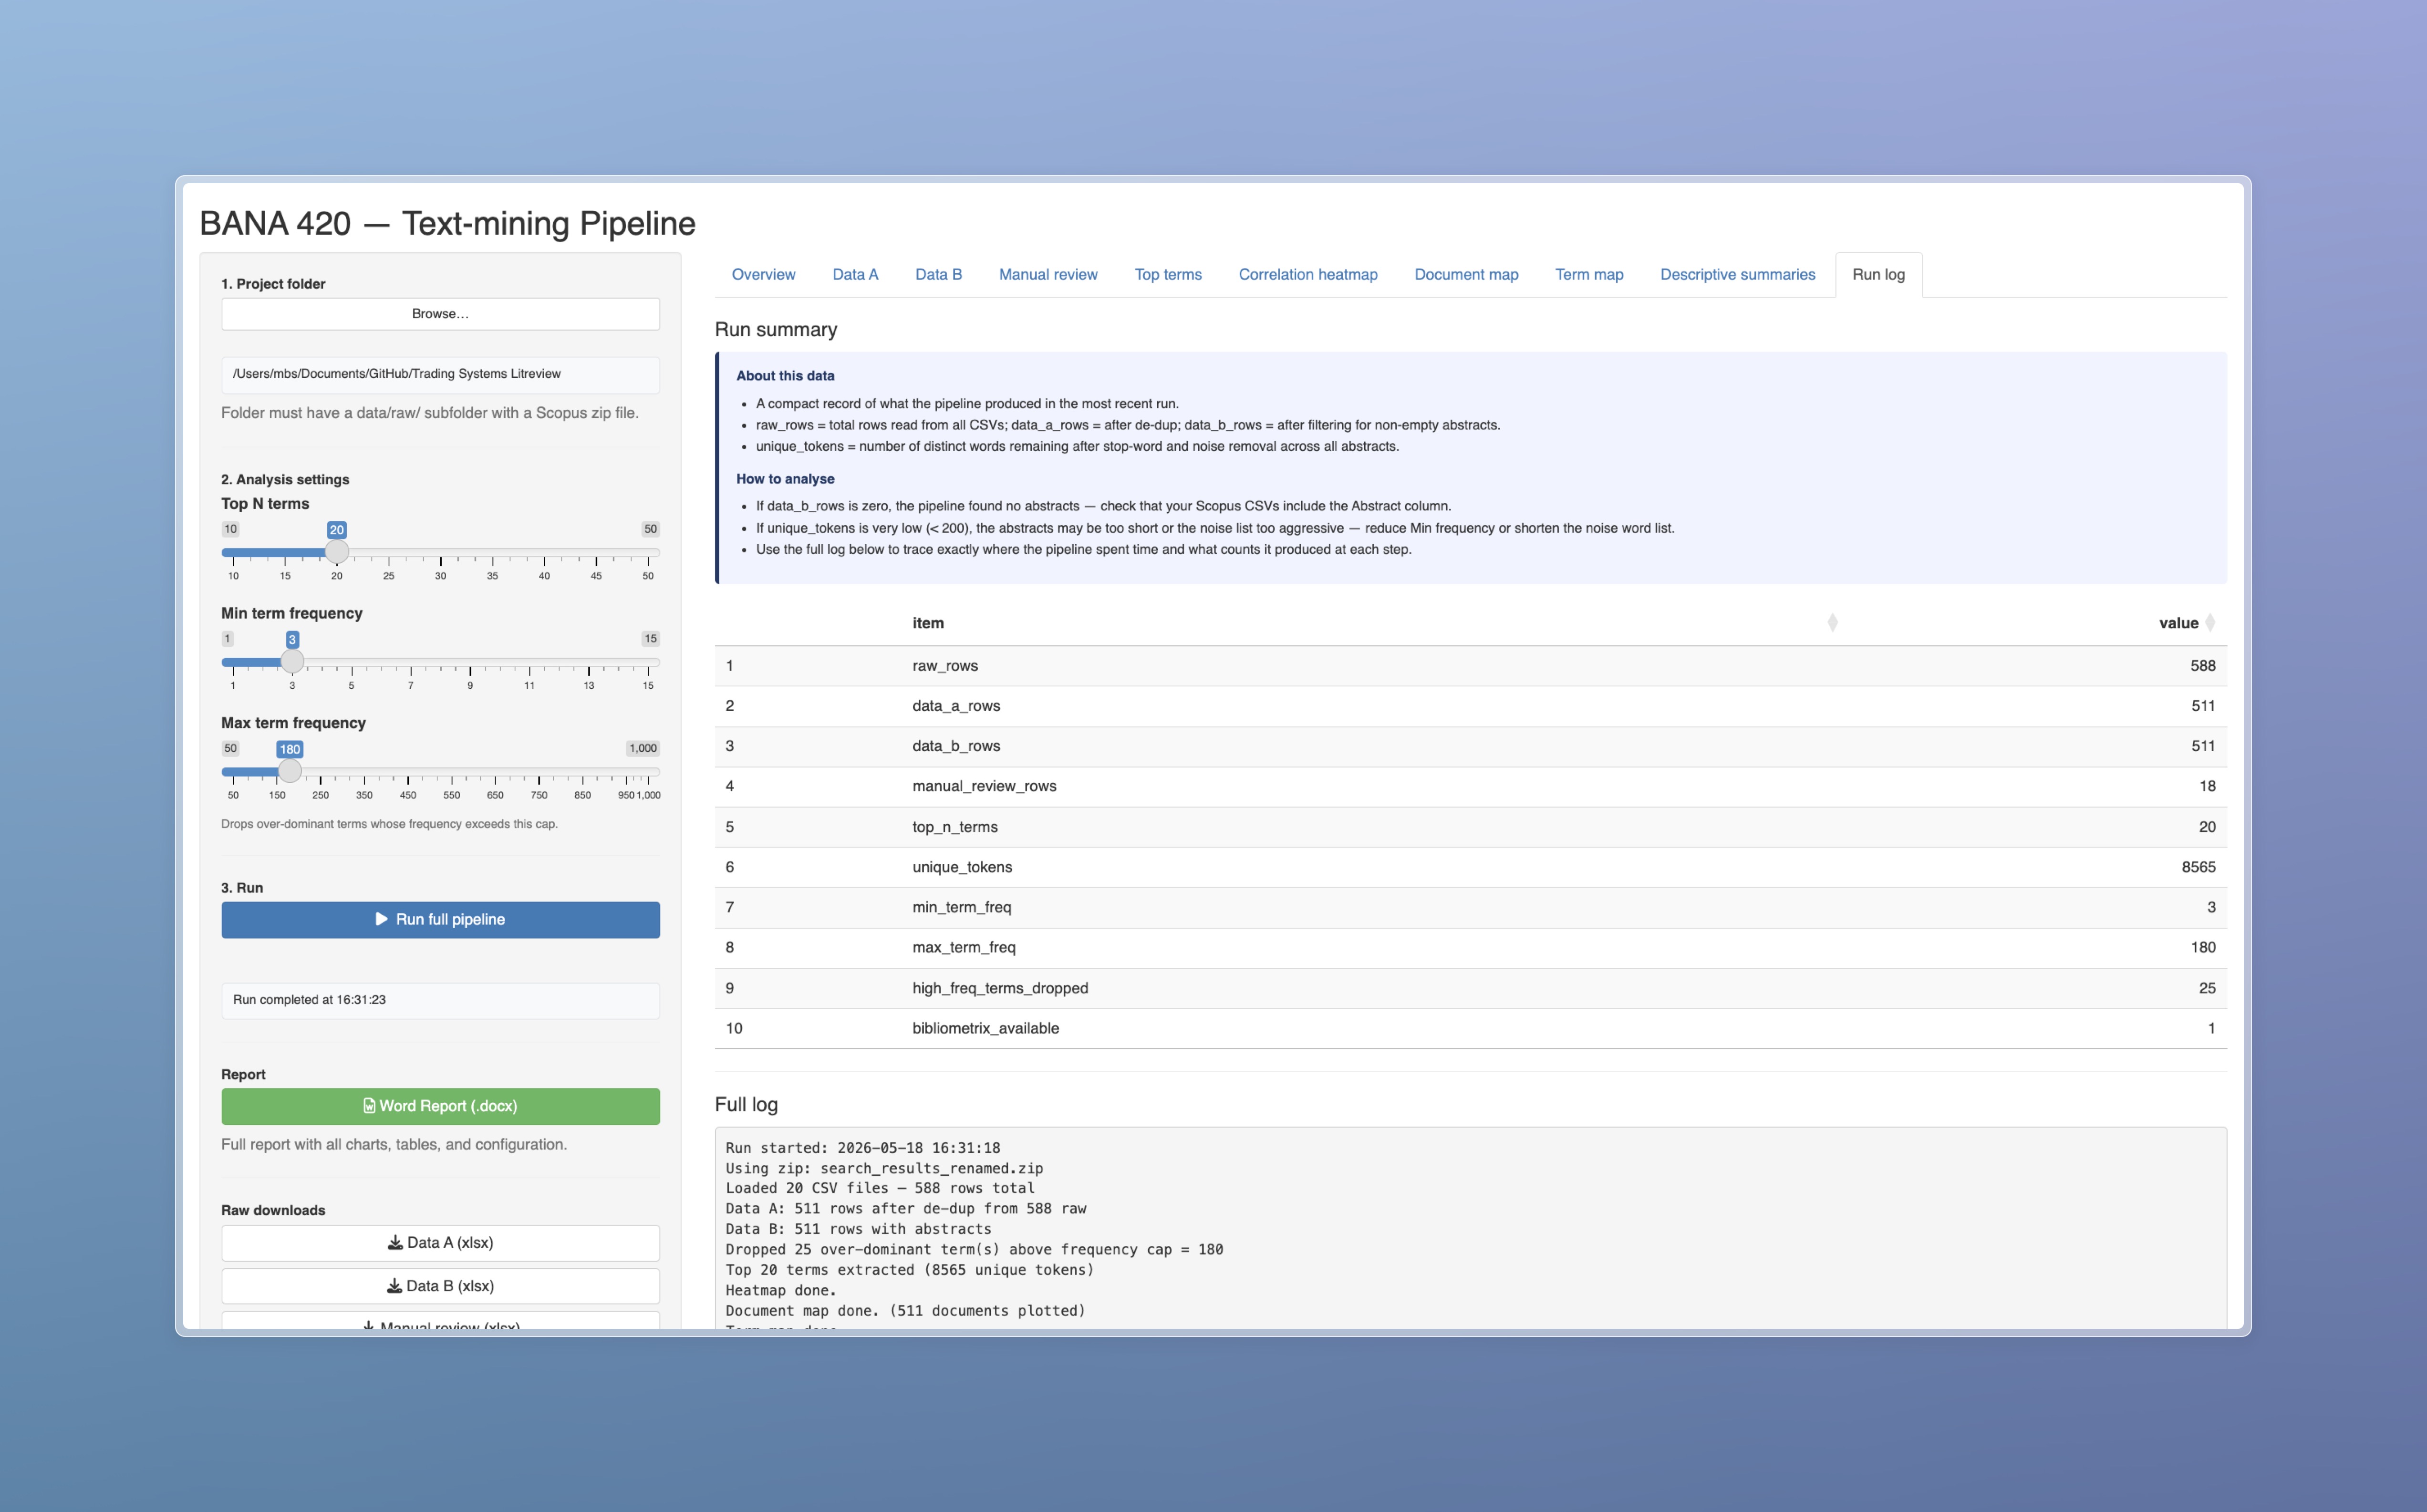
I started by turning the review into a research system

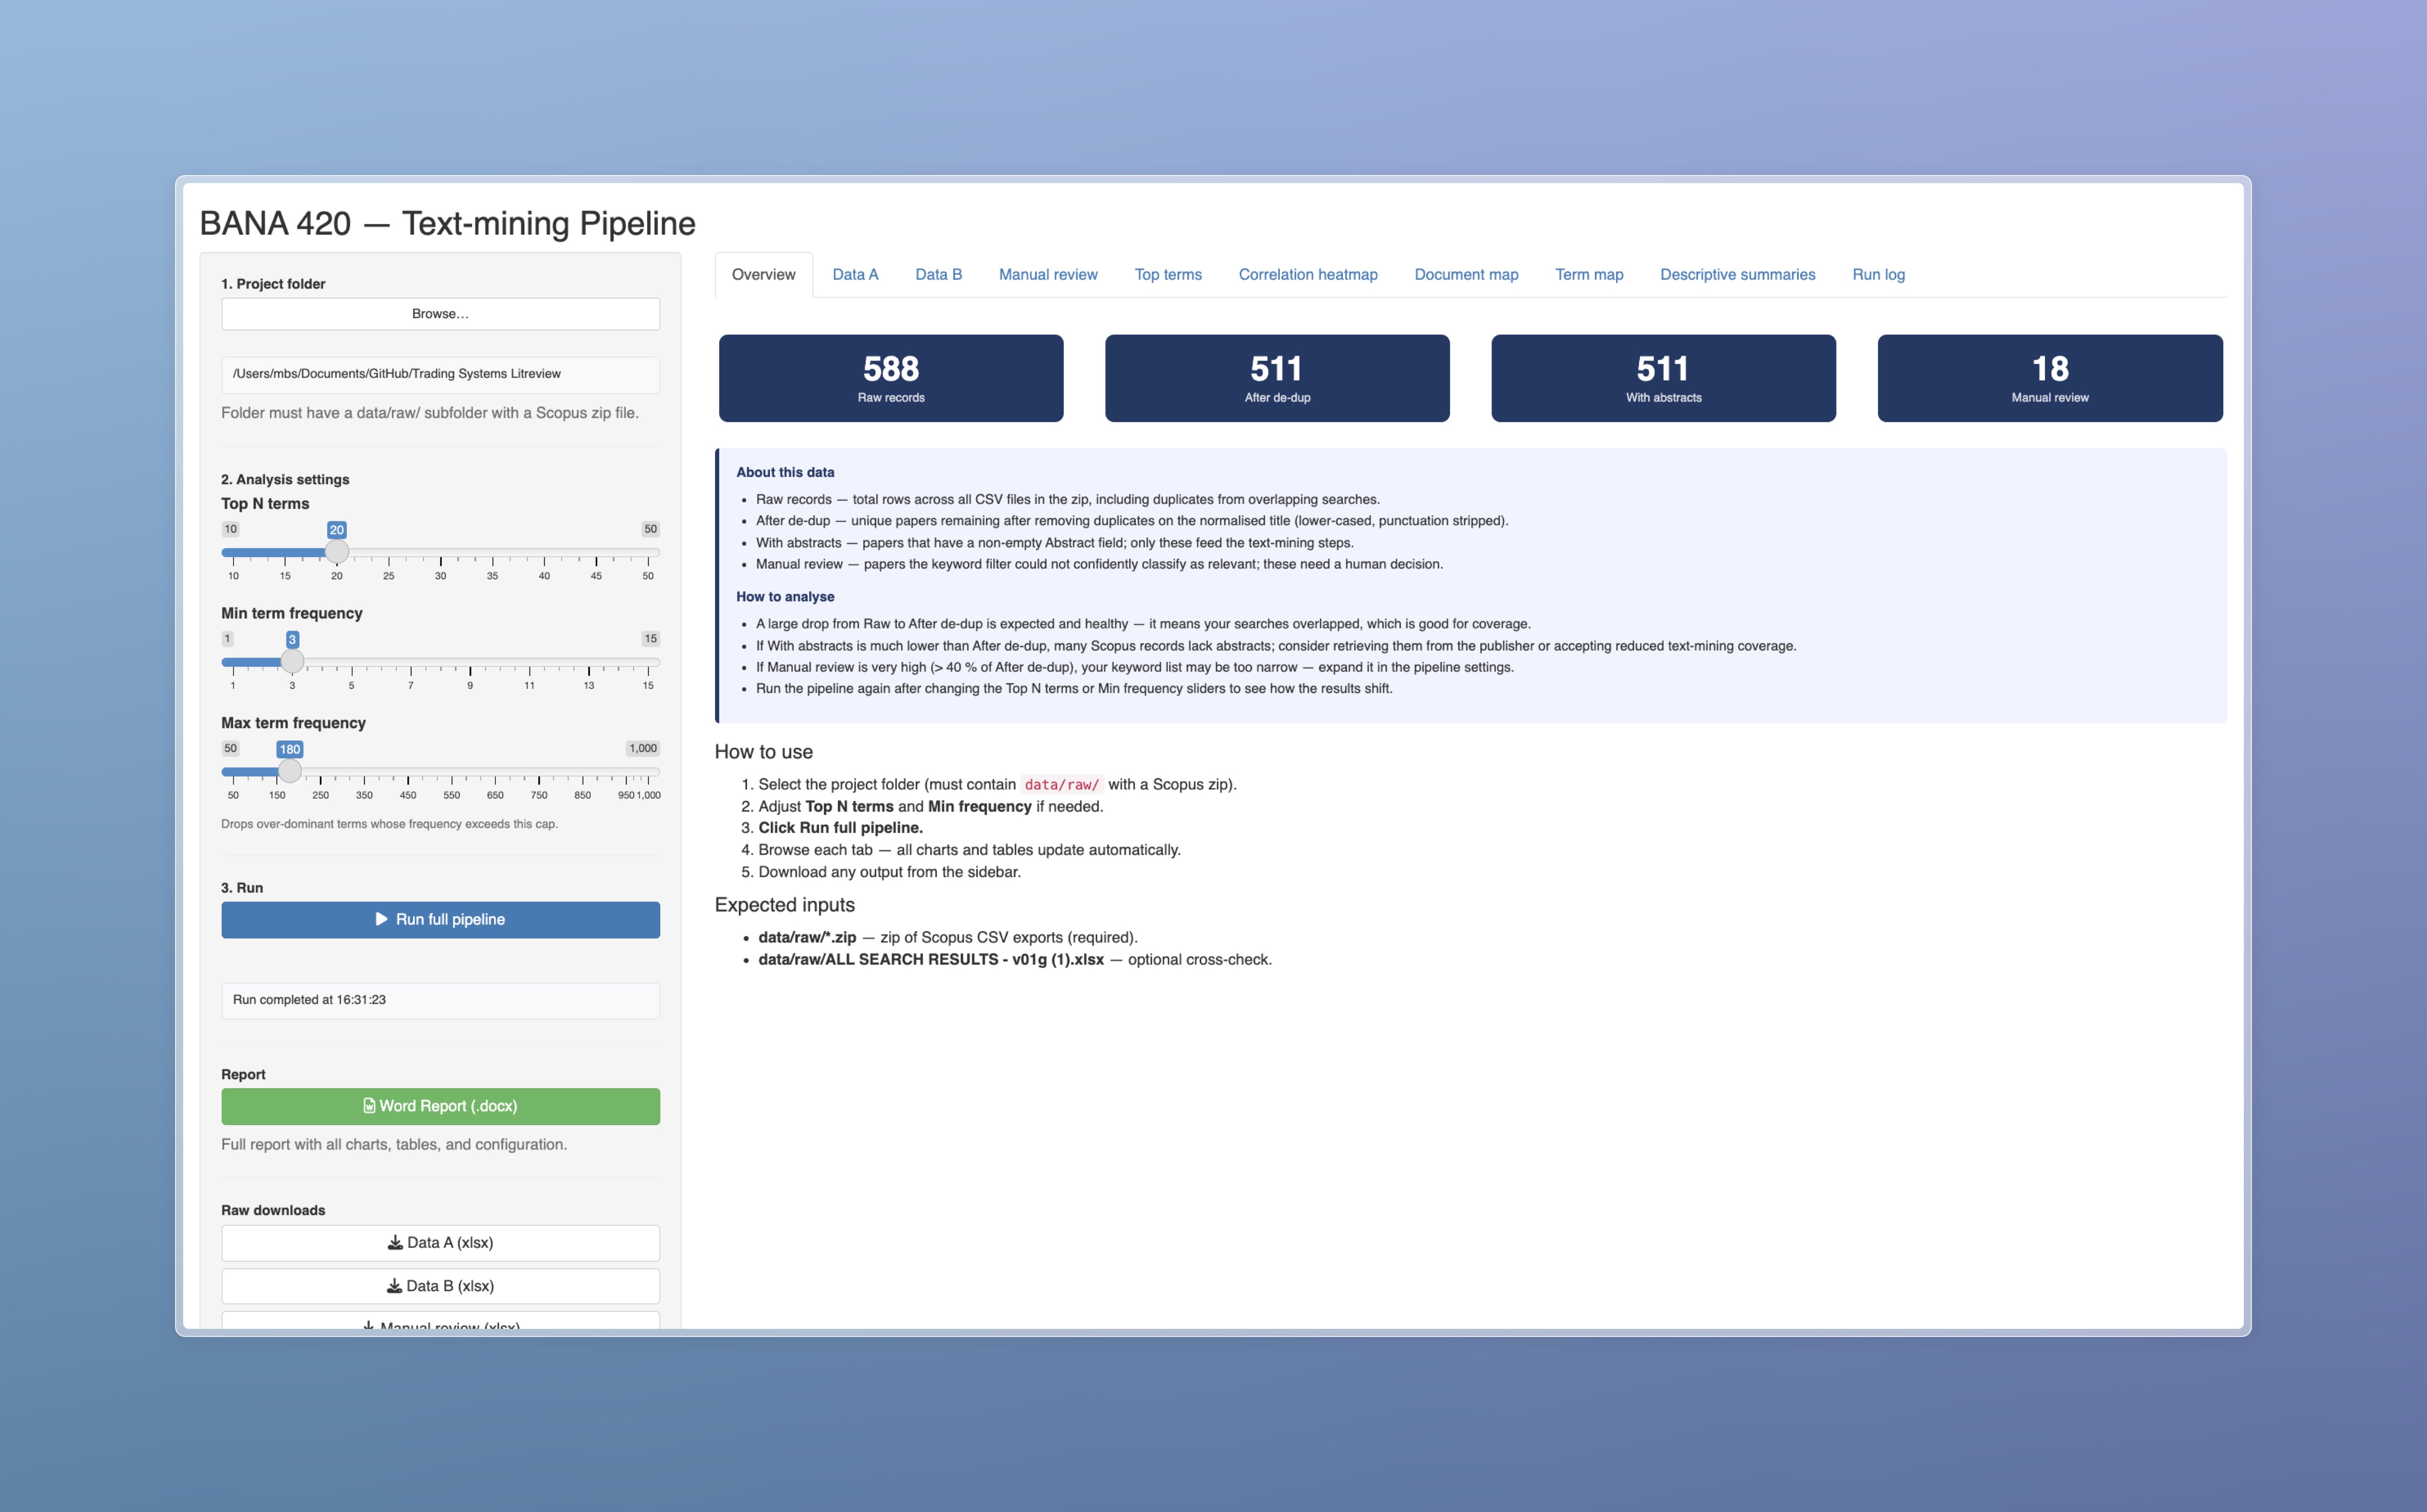
My first decision was methodological: I did not want the project to end as a static spreadsheet. I wanted a workflow where I could load the Scopus exports, tune the term filters, rerun the analysis, inspect each output, and download the evidence. The Shiny dashboard gave me that control surface, so the case study became something I could demonstrate and reproduce rather than only describe.

Shiny dashboard overview for the trading systems literature review
The dashboard is where I controlled the pipeline, checked the corpus counts, and exported the research artifacts.

I made the screening process defensible

The PRISMA-style flow became the backbone of the case. I started with 588 Scopus records from 20 search queries, removed 77 duplicates using a normalized title key, and retained 511 studies with non-empty abstracts. I also separated the 491 papers that passed the keyword relevance logic from the 20 borderline records that needed human review, because the uncertain cases are part of the method rather than a nuisance to hide.

PRISMA 2020 flow diagram for the trading systems literature review corpus
The PRISMA flow records the chain from 588 raw Scopus records to 511 included studies, including the manual-review queue.

I separated the corpus into auditable data products

I built two linked datasets. Data A is the cleaned master table with bibliographic fields, search provenance, PaperID, and topic flags. Data B is the abstract-only text-mining input, reduced to PaperID and abstract so every downstream token, map, and correlation can be traced back to a source record. The run log closes the loop by recording the exact counts and parameter values from the pipeline run.

Data A master corpus table with provenance and topic fields
Data A preserves the bibliographic and provenance fields I needed for auditability.
Data B abstract text-mining table
Data B gives the text-mining steps a controlled PaperID plus abstract input.
Run log and metadata table from the Shiny dashboard
The run log records counts, thresholds, token totals, and pipeline availability checks.

I used text mining to identify the vocabulary of the field

Once the corpus was clean, I used tokenization, stop-word removal, noise-word filtering, and frequency thresholds to focus on informative terms. The top terms show the working language of this review: requirements, development, online systems, blockchain, networks, commerce, decision-making, risk, price, and markets. That vocabulary told me the corpus was not only about trading finance; it was also about systems, platforms, user-facing technology, and decision support.

Top 20 most frequent terms after text-mining filters
The top-term chart shows the filtered vocabulary that shaped the later heatmap and MDS maps.

I tested whether the vocabulary had structure

Frequency alone is not enough for a literature review, so I checked whether terms and papers actually formed interpretable relationships. The correlation heatmap shows how the top terms co-occur across abstracts. The document map projects 511 papers with TF-IDF and MDS, revealing a dense core plus visible outliers. The term map gives me a cleaner concept-level view, where topics such as blockchain, requirements, networks, risk, investment, prediction, commerce, and social context occupy different regions of the map.

Correlation heatmap for the top 20 terms
The heatmap helped me see which terms belonged together and which terms marked separate streams.
Document map using two-dimensional MDS of TF-IDF distances
The document map exposed a dominant paper cluster and a small set of records worth closer inspection.
Term map using two-dimensional MDS of correlation distances
The term map summarizes the corpus at the concept level rather than the document level.

I added bibliometrix to place the corpus in the academic field

After the text-mining layer, I used bibliometrix to ask a different question: where does this research live academically? The annual production curve shows the field accelerating sharply toward 2024 and 2025. Bradford analysis shows a dispersed publication base with core sources such as Lecture Notes in Computer Science, Lecture Notes in Networks and Systems, ACM proceedings, IEEE Access, and Communications in Computer and Information Science. Keyword growth shows commerce, electronic trading, financial markets, investments, decision-making, forecasting, and blockchain becoming increasingly visible.

Annual scientific production chart for the trading systems corpus
The publication curve shows the review topic becoming much more active in the most recent years.
Bradford law plot for source concentration
Bradford analysis helped me describe whether the field is concentrated in a small source core or spread across many venues.
Top keywords cumulative growth chart
Keyword growth shows how commerce, electronic trading, financial markets, investments, decision-making, forecasting, and blockchain developed over time.

I moved from charts to thematic interpretation

The thematic analysis gave me language for the final interpretation. Commerce appeared as the strongest motor theme, while blockchain and finance had high development density. Electronic commerce and decision-making sat closer to basic or transversal themes, and the conceptual structure map separated a broad trading-systems/finance/user-interface region from a smaller AI and language-processing region. This helped me write the case as a map of research streams, not just a list of outputs.

Bibliometrix thematic map for the trading systems corpus
The thematic map positions research streams by centrality and density, turning keyword clusters into interpretable themes.
Conceptual structure map generated with multiple correspondence analysis
The conceptual structure map shows how terms such as stock prediction, time series, user interfaces, data mining, and language processing separate into broader regions.

I used VOSviewer as a second validation layer

I did not want the whole interpretation to depend on one R pipeline, so I exported VOSviewer-ready maps and checked the network structure there as well. The abstract-term co-occurrence map confirmed three major areas: a financial prediction and stock-market cluster, a platform and e-commerce cluster, and a blockchain/energy-trading cluster. Seeing similar structure in a different tool made the final interpretation stronger.

VOSviewer abstract-term co-occurrence network
The VOSviewer network gave me an external check on the clusters detected by the R text-mining and bibliometrix layers.

What this project says about how I work

This case became personal because I was the person holding the whole chain together: the search logic, the cleaning rules, the PaperID system, the Shiny dashboard, the figures, the PRISMA flow, and the academic interpretation. I learned that a strong literature-review project is not only about finding papers. It is about making every decision visible enough that another researcher can follow the path from raw search results to final insight.

Results

  • I combined 20 Scopus query exports into 588 raw records and kept the search-file provenance visible.
  • I removed 77 duplicate records through a normalized-title key, leaving 511 unique studies for synthesis.
  • I preserved 491 automatically related papers and a 20-paper manual-review queue instead of hiding borderline decisions.
  • I extracted 8,565 unique tokens after stop-word, noise-term, and frequency controls.
  • I produced parallel evidence streams: tidytext term maps, bibliometrix figures, VOSviewer networks, Shiny inspection tables, and an exportable report.

Key features

01 PRISMA-style search and screening evidence
02 Title-based deduplication with stable PaperIDs
03 Data A master corpus and Data B abstract-mining corpus
04 Top-term, correlation, MDS, and word-cloud analysis
05 Bibliometrix production, Bradford, trend, and thematic maps
06 VOSviewer co-occurrence validation maps
07 Interactive Shiny dashboard with downloadable outputs
08 Run metadata for academic reproducibility

Tech stack

R Shiny tidytext bibliometrix VOSviewer ggplot2 Python PRISMA 2020 Scopus
Project links

Interested in similar work?

I build systems like this for teams that need reliable engineering, clean interfaces, and measurable outcomes.